West End: What Was, What Is, What Could Be
A neighborhood analysis and design book for Cincinnati's West End: impressions and history, data maps, a SWOT, and proposals for a highway cap, a community center, and Ezzard Charles Park.
- Role
- Team of three. I made the imageability map, the SWOT maps, the Ezzard Charles Park recommendations, the highway cap concept, and the community center, and laid out my own expanded edition of the book
- Timeframe
- Spring 2025 · Studio, 15 weeks
- Location
- West End, Cincinnati, Ohio
- With
- Andrew B., Matthew C.
- Tools
- Adobe InDesign
- Illustrator
- Photoshop
- SketchUp
- ArcGIS
The neighborhood
The West End is a small neighborhood of about 7,000 people wedged between I-75 and Over-the-Rhine. It has been home to some of Cincinnati’s most marginalized communities for well over a century, and today it holds most of the city’s public housing. With TQL Stadium built on its edge and Over-the-Rhine’s investment pushing west, the next few decisions will decide whether the place is still recognizable in fifty years.
Our studio spent the term on the neighborhood in three parts, which became the three chapters of the book: what was, what is, and what could be.
What was: impressions and history
We started by walking the neighborhood and mapping our impressions separately, then combining them. My imageability map picked out the edges, paths, landmarks, and districts as I experienced them. The combined map showed the strongest assets (plenty of green space and a good scattering of landmarks) and the biggest flaws: heavy edges on every side that pen the neighborhood in, and no commercial district, so residents have to leave for basic needs.
The history chapter follows the neighborhood from meatpacking and brewing through the postwar highway construction that split it into Queensgate and the West End, the public housing that replaced the historic housing stock, and the current wave of stadium-driven investment.
What is: data and analysis
The data chapter maps education, pollution, and health at the neighborhood scale. The West End sits in the basin, so it carries elevated pollution, but less than its neighbors to the east and west. Health is worse. There is almost no healthcare in the neighborhood, and the effects add up for longtime residents.
The urban design analysis includes a figure ground of every building in the neighborhood, a linkages map of paths, intersections, and walksheds, and sections through Liberty and Linn streets (the neighborhood’s spine, which also turns its middle into a drive-through) and the Dayton Street Historic District.
What could be: SWOT and proposals
The SWOT maps locate each strength, weakness, opportunity, and threat on the neighborhood map. Strengths: the Dayton Street Historic District, proximity to downtown, and green space. Weaknesses: failing infrastructure, no business district, low density, and dilapidated property. Opportunities: the historic housing stock, spreading investment, large vacant sites, and nearby jobs. Threats: a business district that grows without protecting residents, Liberty and Linn as busy thoroughfares, gentrification, and speculation.
My three proposals each answer one of those gaps.
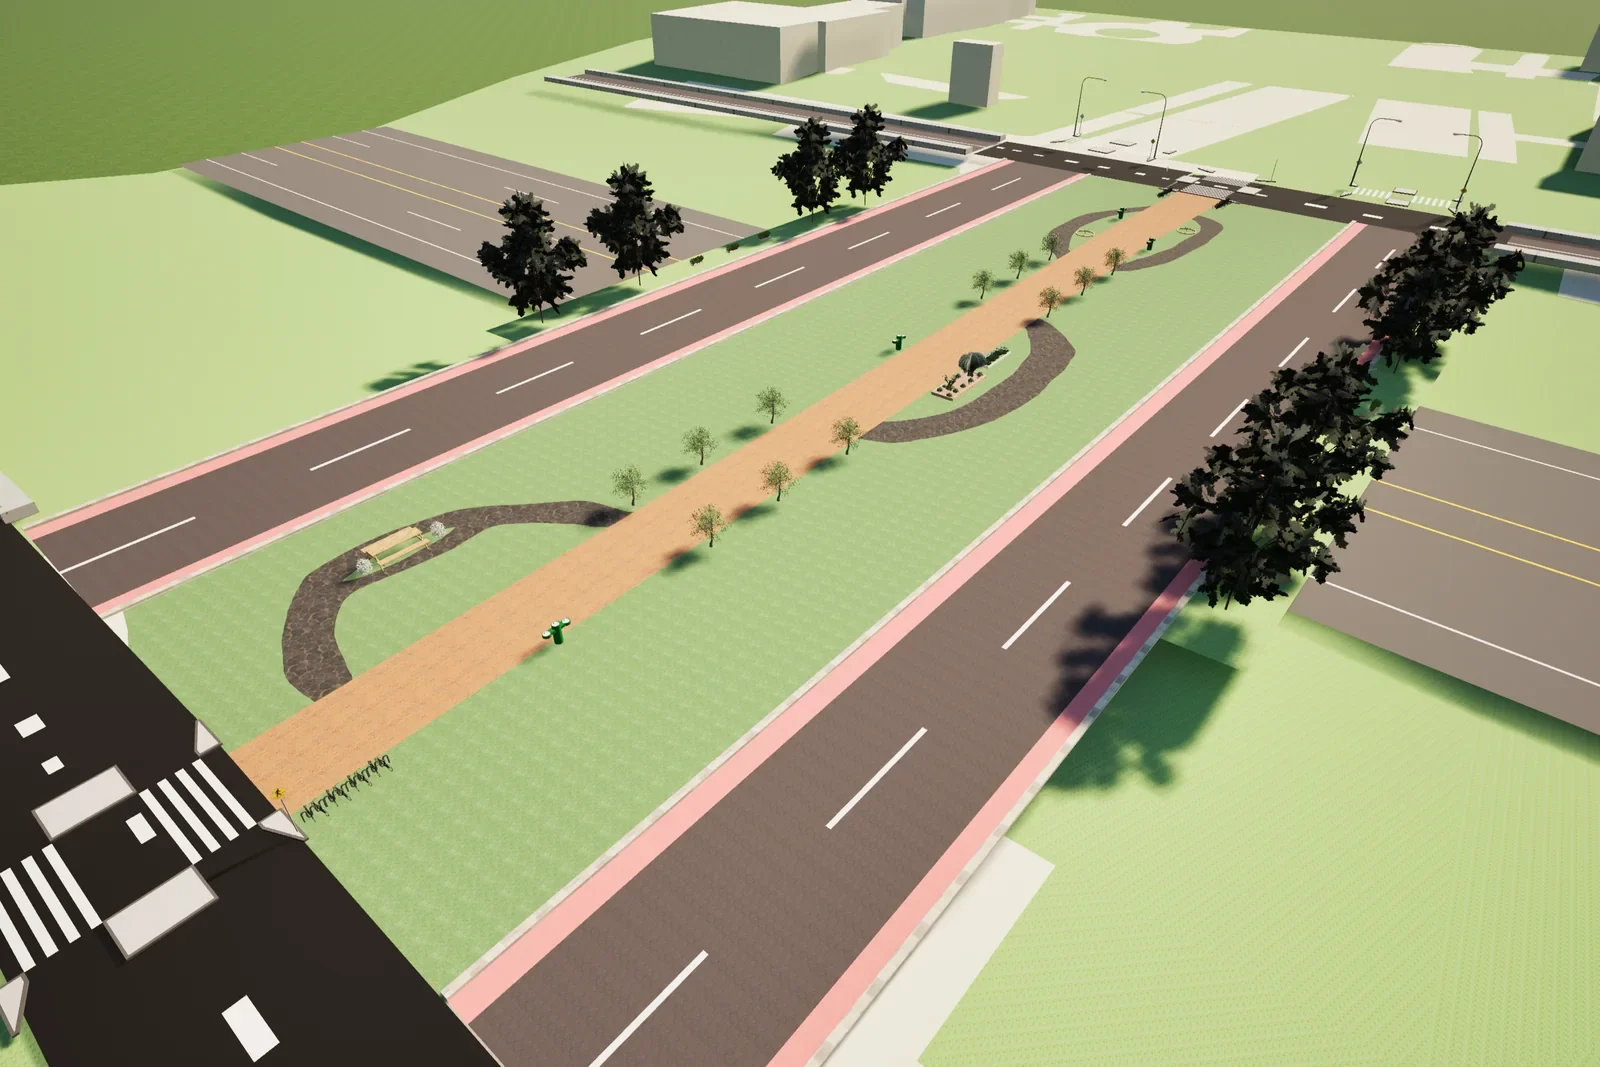
Ezzard Charles Highway Overpass Cap. A park cap over the I-75 overpass at Ezzard Charles Drive, reconnecting the West End with Union Terminal and Queensgate. The SketchUp model works out the paths, plantings, water fountains, and bike racks on the cap and the crosswalk at each end.
Ezzard Community Center. A community center for the West End with a basketball court, community gardens, indoor gathering space, a pad for pop-up shops, and shaded areas to sit. The neighborhood has almost no indoor social space, so this goes next to the park.
Ezzard Charles Park. The park (formerly Laurel Park) has a big lawn and old trees but few of the basics: benches, playgrounds, picnic tables, restrooms. The renderings add trees, benches, fountains, a playground, paths, and new houses along its edge, so the investment arriving with the stadium has somewhere to land without spreading through the rest of the neighborhood.
The book
After the team book was finished, I laid out my own expanded edition to tighten the story and give the maps more room. These are its pages.
Pages from my edition of the West End book. Click to enlarge.