Atlanta Zoning 2.0: What Could Be Built Here, and Where Missing-Middle Housing Fits
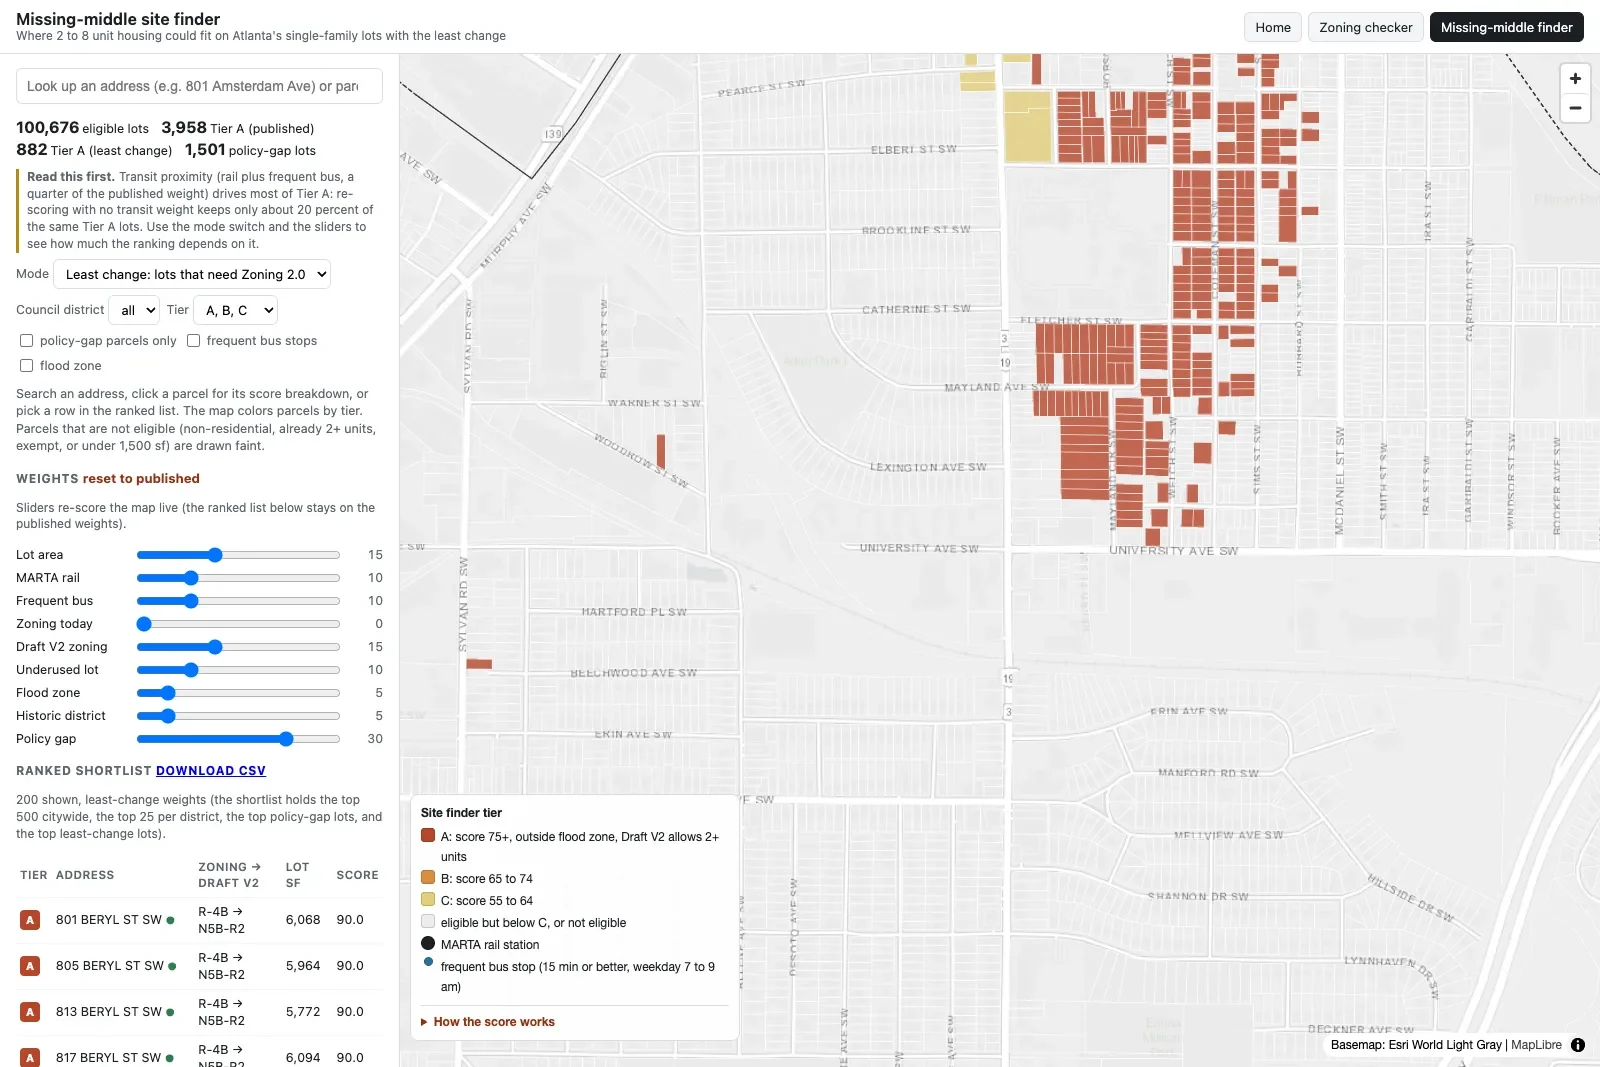
Two linked tools for Atlanta: a parcel checker that puts today's zoning next to the ATL Zoning 2.0 Draft V2 district for every lot, and a scored map of the 100,676 single-family lots where two to eight homes could fit with the least change.
- Role
- Solo. Data pipeline, code reading, scoring method, cartography, and the two web tools
- Timeframe
- September 2026 · About a week
- Location
- Atlanta, Georgia
- Tools
- Python
- GeoPandas
- QGIS
- MARTA GTFS
- FEMA NFHL
- tippecanoe
- MapLibre GL
- PMTiles
- Claude Code
The question
Atlanta is replacing its 1982 zoning ordinance. The draft, ATL Zoning 2.0, gives every lot a Form district that sets lot minimums and a per-lot unit cap, and a Use district that says whether housing is allowed at all. The obvious question for a homeowner, a small builder, or a council office is whether the rewrite changes what can be built on a given lot. The second question follows from the first: if the city wants duplexes, triplexes and small apartment buildings, which single-family lots are the natural places for them?
I built one pipeline that answers both, and two web pages on top of it.
Approach
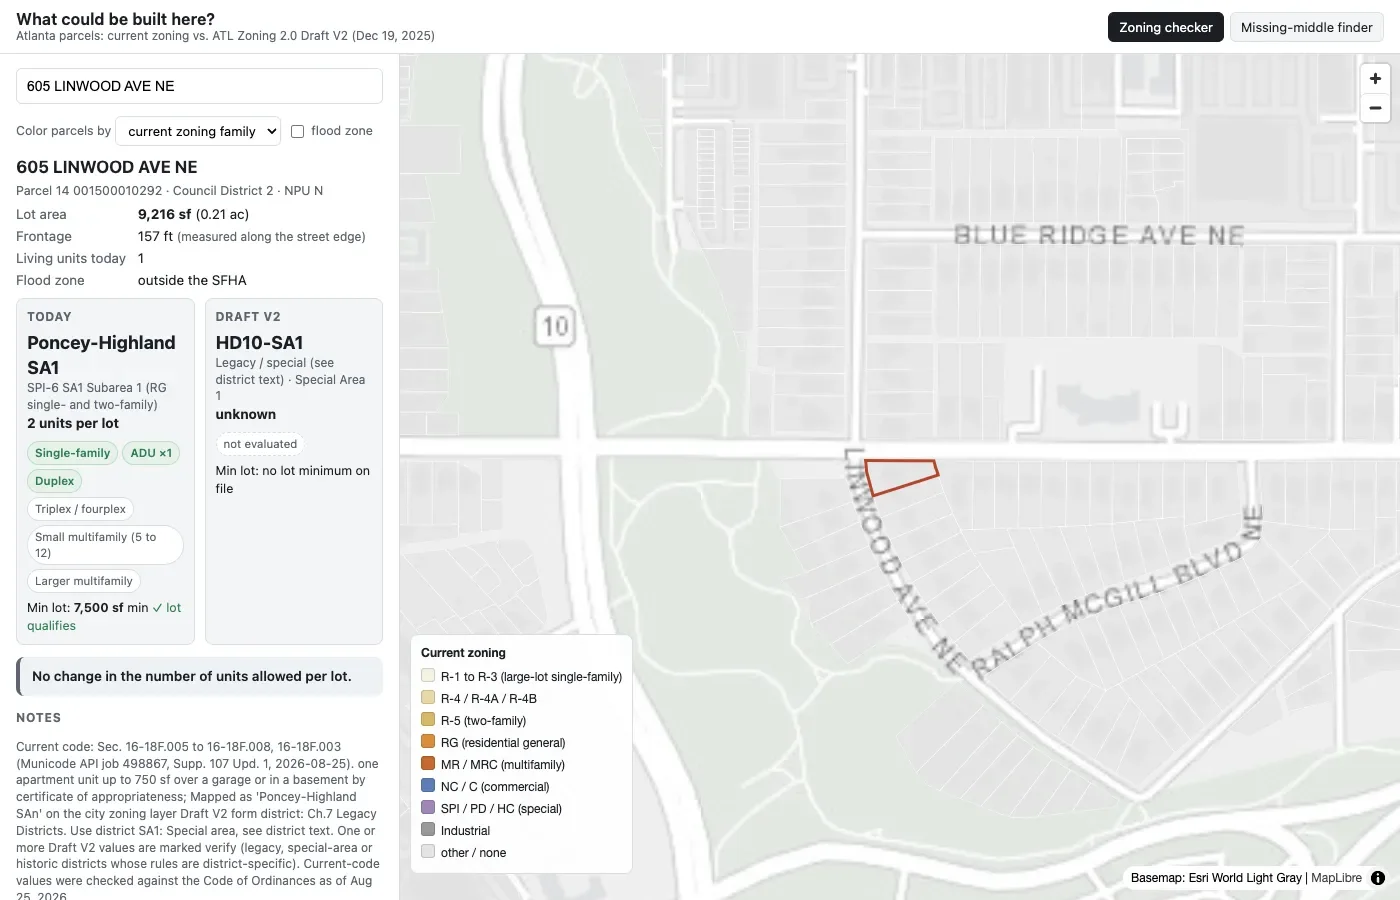
One parcel base. The city’s tax parcel layer (171,156 rows, both counties) is cleaned to 141,881 land parcels. Current zoning and the Draft V2 district are attached by overlaying the two zoning maps in QGIS and taking the district that covers most of each lot. As a check, the city’s own zoning label agrees with the “existing zoning” field on the Draft V2 map for 99.7 percent of parcels.
Reading both codes. Draft V2’s Form and Use chapters are parsed from the chapter PDFs into lookup tables, with the rows the parser could not read filled in from page images and marked. The current code is read from the Code of Ordinances as of August 2026, including the subarea use tables of the 23 special public interest (SPI) districts, which the spreadsheet export truncates and which I pulled from Municode’s content API instead. Every value carries a citation and a confidence flag, and the pages draw unconfirmed values with a dashed outline rather than hiding the gap.
Measured frontage. Lot width checks need real street frontage, not a bounding box. Each parcel edge that runs within 45 feet of a street centerline and within 30 degrees of its bearing counts as frontage, which handles corner and flag lots and gives a median frontage of 70 feet, the R-4 minimum.
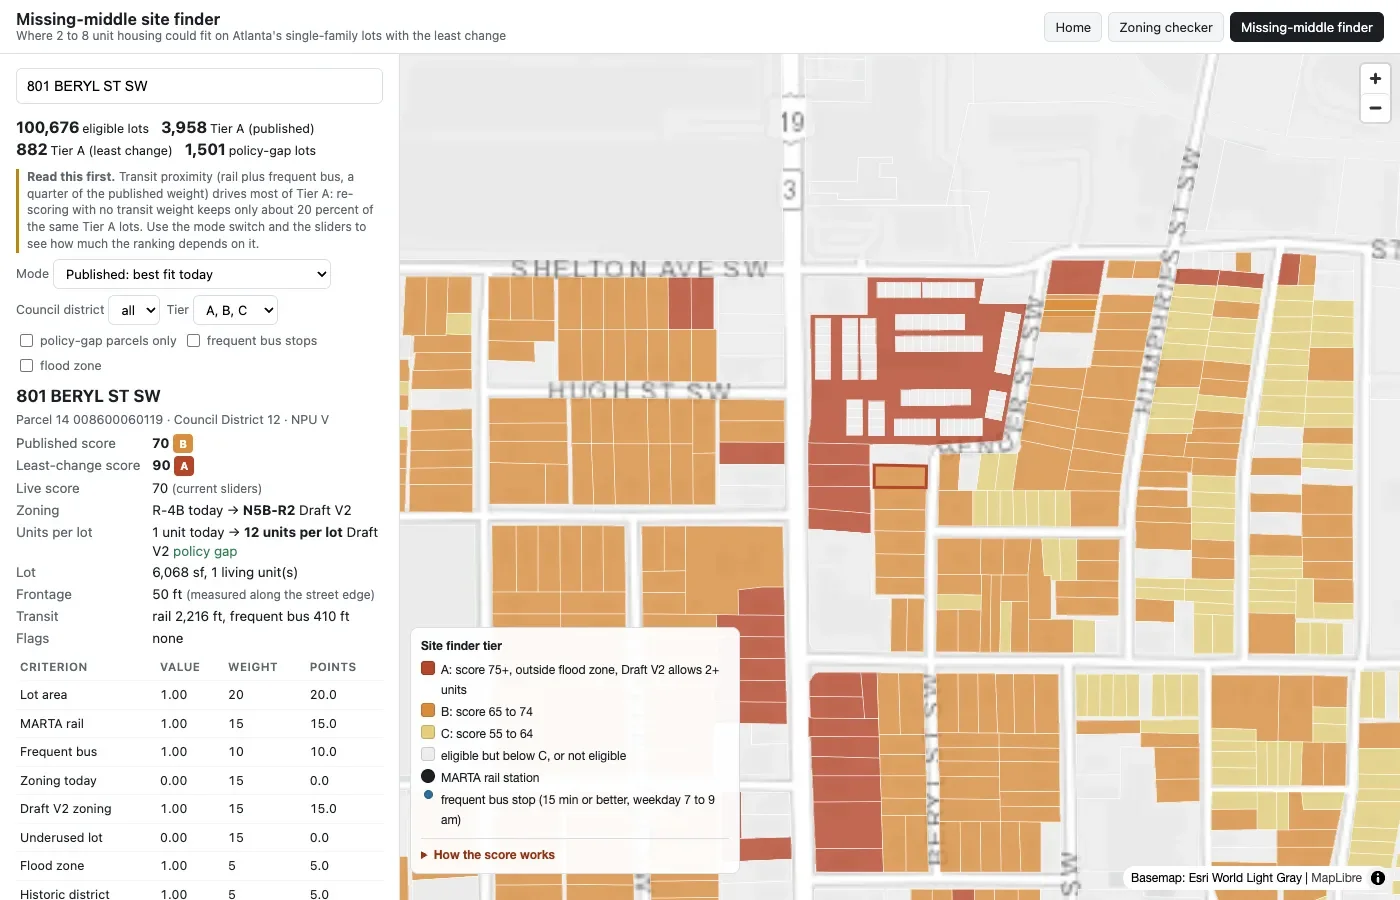
The site finder score. Residential lots with at most one home, at least 1,500 square feet, and no tax exemption are scored on nine criteria scaled from 0 to 1: lot area, distance to MARTA rail, distance to a frequent bus stop (15-minute weekday morning headway, from the GTFS feed), what today’s district allows, what Draft V2 allows, how underused the lot is, the FEMA flood zone, historic district status, and a “policy gap” flag for lots that gain capacity only under Draft V2. Two weightings ship: a published mode that ranks fit today, and a least-change mode that surfaces the lots that depend on the rewrite. The sliders on the page re-score the map live.
What it found
Draft V2 changes the unit count on few lots. It mostly maps R-4 to N1 (one home plus an accessory unit) and R-5 to N2B (two homes). 1,642 residential lots gain two-or-more-unit capacity, and 1,452 of them are the R-4B lots in Pittsburgh that Draft V2 maps to N5B, a twelve-unit form district on a 2,000 square foot lot. Twenty-three lots lose capacity.
Of 100,676 eligible lots, 3,958 reach Tier A under the published weights, concentrated in R-5 lots in Reynoldstown, Inman Park and Midtown that already allow two homes and sit near rail. Under least-change weights, Tier A is 882 lots, all of them policy-gap lots, almost all in Pittsburgh.
How much to trust it
The finder page opens with the sensitivity result rather than burying it: rail and frequent bus together carry a quarter of the weight but explain most of Tier A, and re-scoring with no transit weight keeps only about a fifth of the same lots. Six known addresses across zoning families are re-checked against the city’s live map services every time the data is rebuilt.
Draft V2 is a proposal, not adopted code, and a Draft V3 is expected; the pipeline is written so that the next draft is a change of two URLs. Conditional zoning, overlays, planned developments and historic subareas carry site-specific rules the tools do not evaluate, and sewer capacity is not a criterion because no public dataset exists.